How to Analyse GA4 Acquisition
The first stage in the Funnel of any business is Acquisition, how the business is acquiring customers – an important one to identify the role of the business position.
Let’s analyse how to analyse the acquisition of any business’s GA4 account.
Firstly analyse the current state of the acquisition, which channels are contributing to the traffic, what’s the last 12 months trend of each channel.
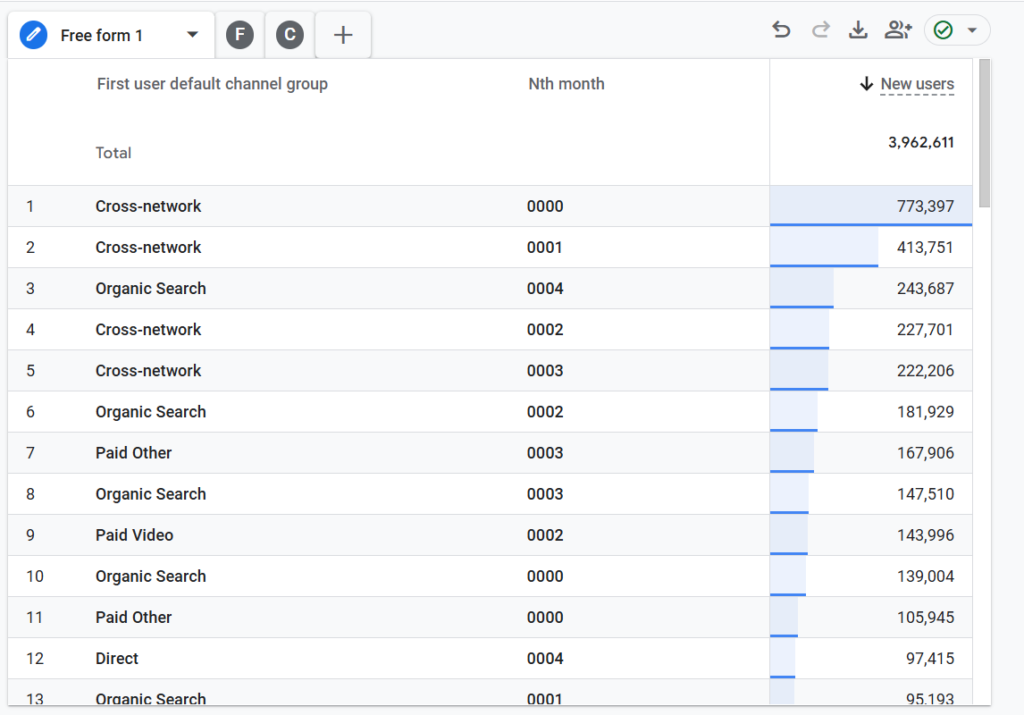
Here extract the data first of the month wise acquisition of new users.
Now format this data like
| First user default channel group | Jan | Feb | Mar | Apr | May | Total | % of Total |
| Cross-network | 7,73,397 | 4,13,751 | 2,27,701 | 2,22,206 | 1,310 | 16,38,365 | 41% |
| Organic Search | 1,39,004 | 95,193 | 1,81,929 | 1,47,510 | 2,43,687 | 8,07,323 | 20% |
| Paid Other | 1,05,945 | 84,022 | 81,820 | 1,67,906 | 19,644 | 4,59,337 | 12% |
| Direct | 35,561 | 37,537 | 67,589 | 72,699 | 97,415 | 3,10,801 | 8% |
| Paid Video | 5,108 | 62,542 | 1,43,996 | 303 | 18 | 2,11,967 | 5% |
| Paid Search | 37,238 | 29,869 | 43,410 | 74,188 | 15,258 | 1,99,963 | 5% |
| Paid Social | 61,810 | 24,708 | 56,937 | 481 | 2,236 | 1,46,172 | 4% |
| Unassigned | 56,513 | 15,058 | 19,027 | 10,641 | 3,576 | 1,04,815 | 3% |
| Organic Video | 40,770 | 181 | 54 | 27 | 23 | 41,055 | 1% |
| Organic Social | 4,915 | 8,118 | 5,795 | 3,280 | 1,669 | 23,777 | 1% |
| Referral | 3,969 | 3,081 | 3,394 | 3,710 | 4,056 | 18,210 | 0% |
| Display | 717 | 14 | 30 | 4 | 10 | 775 | 0% |
| Organic Shopping | 0 | 42 | 1 | 1 | 0 | 44 | 0% |
| 0 | 0 | 0 | 0 | 0 | 0 | 0% |
Now here are the real insights from the raw data –
- Over the Jan–May period, 67% of total new user acquisition was driven by paid channels, with Cross-network alone contributing 41%.
- Paid acquisition began declining in February and collapsed by May — Cross-network dropped from 773K new users in January to 1,310 in May, a 99.8% decline over 5 months. The cause requires investigation at campaign level.
- During the same period Organic Search grew consistently from 139K in January to 243K in May — a 75% increase — without any visible paid support.
- By May, Organic Search had become the dominant acquisition channel by default, already absorbing the paid collapse. The account has shifted from a paid-dependent to an organic-led acquisition engine, not by strategy but by circumstance.
After understanding the current state of the business acquisition, there are threats that exist in the accounts. Let’s move into these threats.
Single Channel Dependency
If the business’s acquisition relies too heavily on only a single acquisition channel such as paid, this creates a threat to the acquisition as 1 budget cut, CAC rise and the acquisition will heavily be affected.
The fix to this this is –
- Identify 2nd or 3rd channels driving most acquisitions that are also with consistent monthly trend for at least a few months or consistently growing in numbers not in percentages because 10 to 100 is 900% growth which will be very misleading while taking the decision.
Here is the insight for this:
Cross-network owned 41% of total acquisition. Its collapse exposed the account’s over-reliance on one uncontrollable paid channel.
When paid restarts the same dependency risk returns unless organic maintains a meaningful share of total new users.
Unstable Acquisition
If the acquisition from the channels are constantly changing monthly, then it is a threat to the business.
This is how you identify it –
| First user default channel group | Jan-Feb% | Feb-Mar% | Mar-Apr% | Apr-May% | Variance | Normalised | May Users % | Floor Candidate |
| Paid Video | 1124% | 130% | -100% | -94% | 505% | 1.00 | 0% | ❌ |
| Paid Social | -60% | 130% | -99% | 365% | 184% | 0.35 | 1% | ❌ |
| Paid Search | -20% | 45% | 71% | -79% | 59% | 0.09 | 4% | ✅ Floor Candidate |
| Organic Search | -32% | 91% | -19% | 65% | 53% | 0.08 | 63% | ✅ Floor Candidate |
| Cross-network | -47% | -45% | -2% | -99% | 34% | 0.04 | 0% | ❌ |
| Direct | 6% | 80% | 8% | 34% | 30% | 0.03 | 25% | ✅ Floor Candidate |
| Unassigned | -73% | 26% | -44% | -66% | 39% | 0.05 | 1% | ❌ |
| Referral | -22% | 10% | 9% | 9% | 14% | 0.00 | 1% | ❌ |
| Organic Social | 65% | -29% | -43% | -49% | 46% | 0.07 | 0% | ❌ |
| Organic Video | -100% | -70% | -50% | -15% | 31% | 0.03 | 0% | ❌ |
| #DIV/0! | #DIV/0! | #DIV/0! | #DIV/0! | 0% | ❌ | |||
| Paid Other | -21% | -3% | 105% | -88% | 69% | 0.11 | 5% | ✅ Floor Candidate |
| Display | -98% | 114% | -87% | 150% | 113% | 0.20 | 0% | ❌ |
| Organic Shopping | #DIV/0! | -98% | 0% | -100% | 0% | ❌ |
Here calculate the Month-over-month change of the channels, then calculate variance of each channel which will tell how volatile each channel is the more the variance the more volatile the channel.
For better interpretation let’s normalise the variance in the range of 0-1, the close to 0, the stable the acquisition and if the channel is close to 1 it will be the more unstable. That’s the basic statistics we use in marketing.
The fix of this threat is the concept of Floor Candidates –
Floor Candidates are the channels that can keep the acquisition alive when the primary channels paid channels drop.
To be a floor candidate there are 3 conditions –
Condition 1 – Channel type
Must be organic or direct only. Paid channels are excluded because they can be turned off by a budget decision, so they can’t be a reliable floor.
Condition 2 – Volume
Must be contributing meaningfully to total new users in the most recent month. Too small a channel can’t absorb anything even if it’s perfectly stable.
Condition 3 – Stability
Must have low normalised variance – meaning consistent MoM volume without big swings. A channel that’s sometimes large and sometimes tiny isn’t a reliable floor even if its average looks good.
Insight here is –
This is not an active threat in May, organic and direct are now the dominant channels. However when paid restarts and organic share drops relatively, this threat reactivates. Monitor floor candidate ratio as paid scales.
Unattributed Traffic
It checks how much acquisition is invisible and therefore unprotectable and unscalable?
The fix here is UTM audit – go into the traffic sources sending unassigned users and identify which campaigns or channels are missing UTM parameters. Fix the UTMs, the unattributed traffic gets classified correctly.
Insight – Minor threat. Unassigned at 3% of total new users and declining. UTM audit recommended but not urgent.
Opportunity
Organic Search has proven it can carry acquisition through 5 months of paid collapse. The business now has real data to justify investing in organic as a primary channel rather than a backup. This is the moment to build organic before paid restarts — not after.